A Pilot's Guide to Inflight Icing
Module I - Before You Fly
Check the Weather
Section: CIP & FIP
Start This SectionCIP & FIP Check the Weather
Step 3. Check the CIP & FIP
The Current Icing Product (CIP) and Forecast Icing Potential (FIP) are available from the Aviation Weather Center. In one location, this resource provides a wealth of information about aviation weather hazards. This site does an especially good job of painting the icing threat.
On the "Icing" Tab you can view standard weather briefing material in a graphical format, including Current Icing Advisories, PIREPS, and Freezing Level.
Perhaps the most powerful feature of this page that it depicts the current and forecast icing picture for the U.S., Canada and Mexico.

NOAA's Aviation Weather Center ADDS Icing page contains both official and supplementary (CIP & FIP) icing information.
CIP & FIP Check the Weather
The CIP and FIP provide information on the icing severity (intensity) at specific altitudes and geographic locations. The Supercooled Large Droplet (SLD) icing threat and recent PIREPS near the selected altitudes are co-plotted. You can also access the icing potential (probability).
FIP can be used before you file to find the best altitude to cruise. Then just before departure, CIP can be use to get the latest information on the icing threat.

A CIP display showing Maximum Icing Severity. Also depicted are the threat of SLD and recent PIREPS.
CIP & FIP Check the Weather
Another tool, the Flight Path Tool (which can also be found under “Java Tools” tab) can depict the icing threat in a vertical cross-section along your planned route.
This should help you plan your altitudes given the MEA and your practical service ceiling, and give you a sense of whether climbing or descending is the best escape route from an icing encounter.
Note: These are evolving web sites. The online help will illuminate the latest features, and help you get the most use of all this site offers. Also, check the date/time to make sure you are looking at the most recent images, and not cached ones.

Flight Path Tool display: User selected route with icing
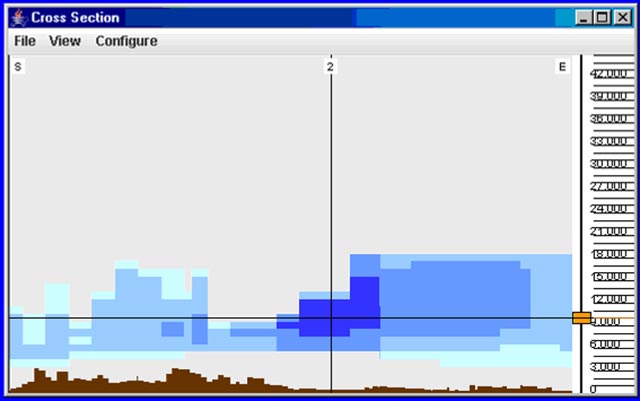
Flight Path Tool display: Corresponding cross-sectional view