A Pilot's Guide to Ground Icing
Module II - Cues
How to tell when you should worry
Section: Weather Information Sources
Start This SectionWeather Information Sources Cues
To get an overall picture of the potential for ground icing conditions, use a variety of tools: METAR, TAF, radar, surface prog charts, or the local news. You can find this information from the official weather briefer (Flight Service Station), free or subscription internet weather services – a partial list is provided on page 3 of this section.
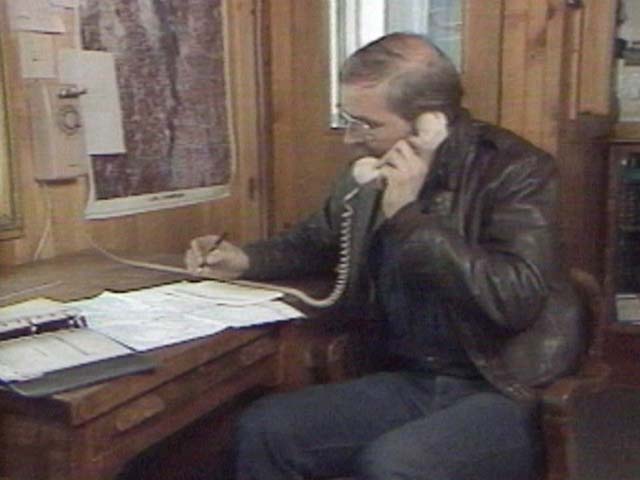
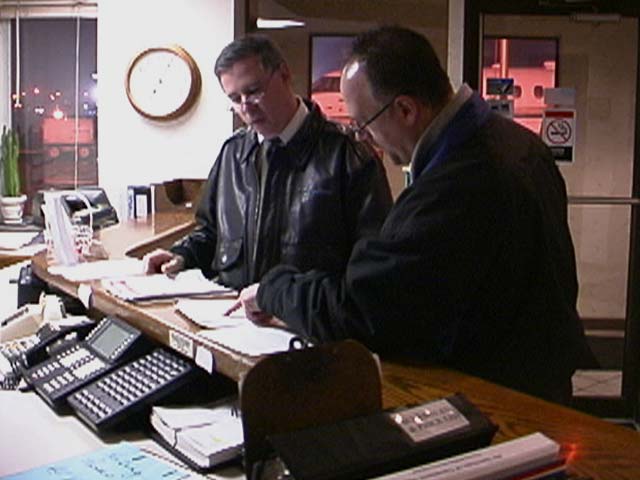
While many sources on the internet and TV can give you information regarding the potential for ground (and in-flight) icing, they should be a supplement to an official weather brief. The weather briefer (Flight Service Station) has the necessary tools to advise you on anticipated conditions.

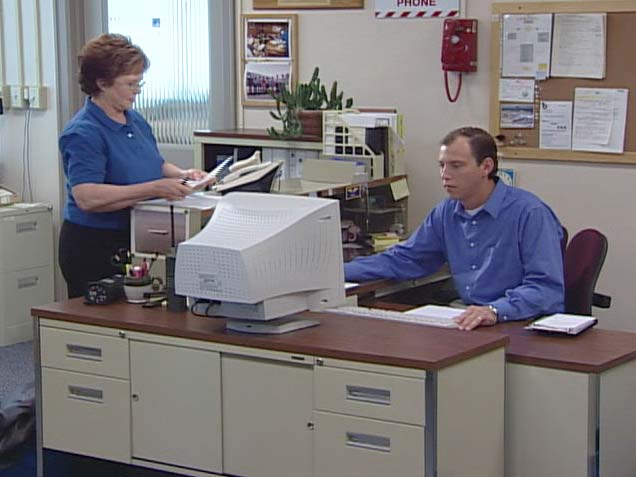
Use a variety of tools to obtain ground icing conditions
Weather Information Sources Cues
Look for the following indicators of ground (and possibly in-flight) icing conditions or ask the briefer to look at them for you:
- Forecast temperatures and dewpoints (if available): look for temperatures near freezing and temperature/dewpoint spreads of 3C (5F) or less.
- Area Forecasts synopsis: look for frontal activity - fronts tend to generate icing conditions.
- AIRMET Zulu and SIGMET: indicate where icing conditions are likely to be found.
- Freezing Level: look for freezing levels at or near field elevation for ground icing, or at altitude for in-flight icing.
- TAFs: look for forecast precipitation type and intensity, and other signs of possible icing at specific airports.
- METARs, including past METARS: look for trends favorable to icing.
- Icing PIREPs: look for reports of icing enroute & in the vicinity of your destination/alternate airports, and enroute.
- CIP & FIP: look for icing potential at/near the field elevation of your destination/alternate airports & enroute.
Further Information
CIP is output on a grid with pixels every 40 km at 1000-foot vertical intervals. Aviation Digital Data Service (ADDS) displays every third level except on the Flight Path Tool, which provides access to all levels. To retrieve a CIP graphic on ADDS, simply choose either the "All icing" or "SLD" radio button, then click on the desired altitude. Besides the individual levels, you can select a composite (maximum value of all altitudes), the bases (lowest icing altitude), or tops (highest icing altitude). The latter two choices display the altitude of icing in hundreds of feet above mean sea level. For all graphics except "bases" and "tops", the scale is from 0 to 100 using cool to warm colors with warmer colors indicating higher icing likelihood.
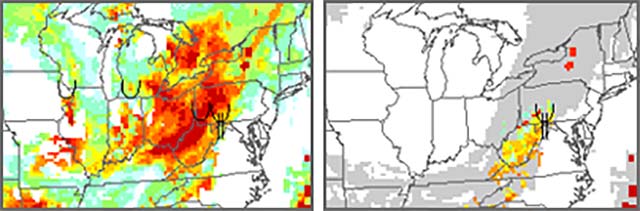
CIP composite graphic (left) and CIP SLD graphic (right)
Pilot reports (PIREPs) of icing are overlaid on the single-level graphics (legend found at the bottom of each graphic) if within 1500 feet vertically and 75 minutes of the valid time. On the composite graphic, PIREPs are for all altitudes. Regions shown in white indicate zero icing potential according to this product. On the SLD graphics, regions shown in gray indicate an icing threat (note these regions are colored in the all icing graphic) but the SLD potential is indeterminate.

ADDS Flight Path Tool showing icing, AIRMETS, SIGMETS, and PIREPS
Weather Information Sources Cues
Here are some free internet sites & telephone numbers you can check to anticipate ground icing conditions.

National Weather Service (NWS)
Aviation Digital Data Service (ADDS)
Aviation Digital Data Service (ADDS) – LoSIGWX
https://www.duat.com
https://www.duats.com
1-800-WX-BRIEF

NAV CANADA – Aviation Weather
1-866-WX-BRIEF

Met Office – Weather Services for Aviation
08700 767 868
Use a variety of tools to obtain ground icing conditions