A Pilot's Guide to Ground Icing
Module V - Anti-Icing Operations
How to keep it off
Section: Snow Intensity vs. Visibility
Start This SectionSnow Intensity vs. Visibility Anti-Icing Operations
For snow conditions, Transport Canada and the FAA provide snowfall intensity vs. visibility charts to help you accurately determine the snowfall intensity (rate). The UKCAA are reviewing the use of these charts. (UK operators should consult the latest Ground De-icing Aeronautical Information Circular for information.)
The snowfall intensities reported by meteorological services (e.g., METAR, ATIS, AWOS, ASOS) and the intensities quoted in the HOT guidelines for snow (i.e., very light, light and moderate) are NOT necessarily equivalent.
Also, reported conditions could be out of date, or there could be a variation between the observe/sensor and your location.
For more on determining snow fall intensity: See TP 14052E, §11.1.4.1
Related Information
DRYDEN, ONTARIO – CANADA
MARCH 10, 1989
F-28
The aircraft was fully loaded and had taken on fuel at Dryden. Light snow had been falling whilst the aircraft was being serviced, but the snowfall became heavy while the aircraft waited for take-off clearance, a period of about 10 minutes.
The captain decided to take-off during a snow storm without having the aircraft de-iced. The wings are thought to have been covered with 0.25 to 0.5 inches of snow, whilst the runway was covered with 0.25 to 0.5 inches of slush. The captain believed that the snow was not adhering to the wings and would blow off on take-off. However, the wing contained cold soaked fuel which caused the wet snow on the wings to freeze.
On it's take-off run, the aircraft was reported by witnesses to have labored down the runway, seeming to lack power. Shortly after becoming airborne, the aircraft struck terrain in a wooded area near the runway. The aircraft broke into three pieces and was destroyed by a post accident fire. The FDR and CVR were extensively damaged and the tapes were later found to have melted. Survivors and other witnesses said that the wings had accumulated a layer of wet snow prior to take-off. There were 24 fatalities and 45 serious injuries.
Snow Intensity vs. Visibility Anti-Icing Operations
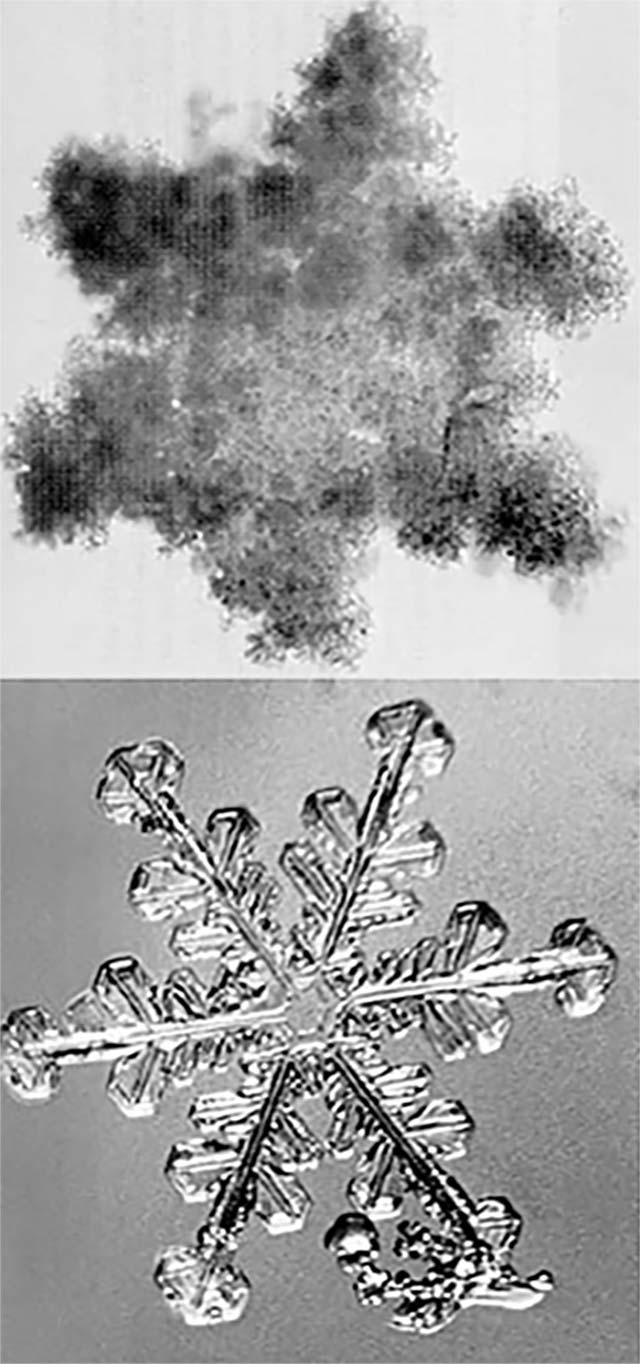
Meteorological services accurately provide intensities for other types of precipitation. However, their approach to estimating snowfall intensity has been based on visibility alone. Recent scientific research indicates that visibility and temperature and day/night lighting conditions must be considered to accurately determine the snowfall rate.
To use the HOT guidelines for snow properly, factor the visibility (from METAR, ATIS, AWOS or ASOS, etc.), temperature and lighting conditions into a Snowfall Intensity vs Visibility chart. For example, if the reported daytime visibility in snow is 1 statute mile and at –7°C, the snowfall rate is light. Similarly, a nighttime visibility of 1 1/2 statute miles at –1°C yields a moderate snowfall rate.
Further Information
Heavier snowfall intensities tend to occur with:
- Lower visibilities
- Warmer temperatures – the warmer it is, the more moisture snow can contain.
- Darker lighting conditions – for the same snowfall intensity, visibility may be twice as far at night than during the day
When you have no ATIS or other access to the reported visibility, or the visibility where you are is obviously different than reported, you may want to assess it for yourself to get a more accurate HOT. Use the visibility to first determine the snowfall intensity, then use that intensity in the HOT Table. This is especially critical if your local conditions appear worse than reported.
Assess the visibility by noting what distant structures (towers, lights, etc.) you can and cannot see, and de-termine their distance from the airport diagram. If you are at the runway, use the runway lights and markings to help assess visibility. Know the standards for these distances (US: AIM or AC 150-5340-1J; Canada: AIM or TP-312; UK: AIP).
Runway markings can help you determine visibility. How many lights and/or markings you can see will tell you visibility in feet/meters. In the picture, you can see about 3 runway lights (200 ft apart), the next set of touchdown zone markings (500 ft apart) and 12 centerline lights (50 ft apart). Therefore, the visibility is about 600 feet – less than 1/8 mile.
You can convert feet/meters to visibility in half-, quarter-, eighth-mile/km increments using a RVR Value Conversions chart.
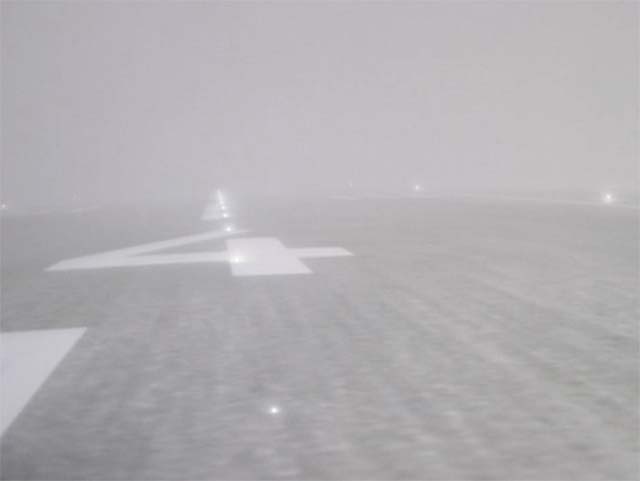
Using runway features to determine visibility. Note: The estimated visibility is about 600 ft (200 m). This is below most nations' departure minima. Unless approved otherwise in your Operator certificate, do not depart below minima.
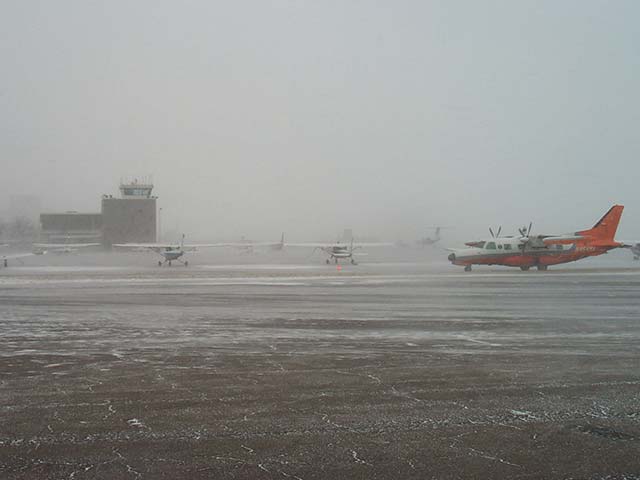
Fog and smoke conditions can artificially reduce the visibility. In this case, the use of the snow intensity chart may not be valid.
If the visibility from your flight deck is lower than reported, precipitation intensities are likely to be higher. Correspondingly, the holdover times will be lower.
When in doubt, err on the conservative side, i.e., go with the higher intensity (shorter HOT).
Snow Intensity vs. Visibility Anti-Icing Operations
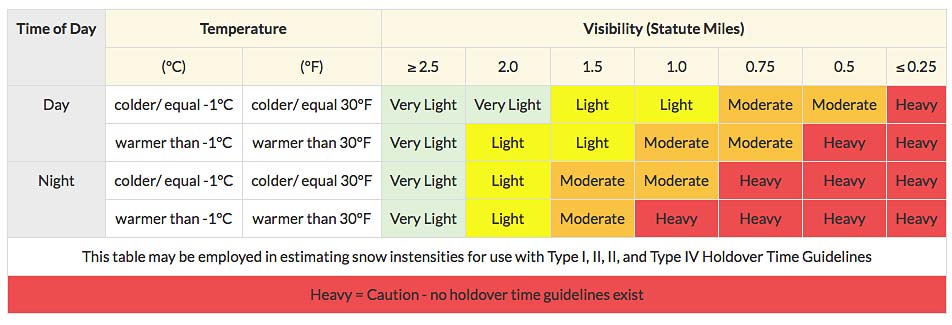
Snowfall Intensity Table
Snowfall Intensities as a Function of Prevailing Visibility for Type I Holdover Time Guidelines. (May also be used with Types II, III and IV fluids.)
Ref: FAA HOT Guidelines for Winter 2006-2007, Table 1B.
| Time of Day | Temperature | Visibility (Statute Miles) | |||||||
|---|---|---|---|---|---|---|---|---|---|
| (°C) | (°F) | ≥ 2.5 | 2.0 | 1.5 | 1.0 | 0.75 | 0.5 | ≤ 0.25 | |
| Day | colder/ equal -1°C | colder/ equal 30°F | Very Light | Very Light | Light | Light | Moderate | Moderate | Heavy |
| warmer than -1°C | warmer than 30°F | Very Light | Light | Light | Moderate | Moderate | Heavy | Heavy | |
| Night | colder/ equal -1°C | colder/ equal 30°F | Very Light | Light | Moderate | Moderate | Heavy | Heavy | Heavy |
| warmer than -1°C | warmer than 30°F | Very Light | Light | Moderate | Heavy | Heavy | Heavy | Heavy | |
| This table may be employed in estimating snow instensities for use with Type I, II, II, and Type IV Holdover Time Guidelines | |||||||||
| Heavy = Caution - no holdover time guidelines exist | |||||||||

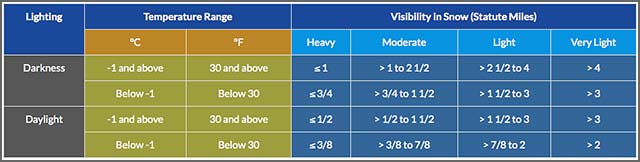
Transport Canada: Visibility in Snow vs. Snowfall Intensity Chart
Ref: Transport Canada Holdover Time Guidelines, Winter 2006-2007, Table 8
Note: Transport Canada presents the same data in a different way than the table above.
| Lighting | Temperature Range | Visibility in Snow (Statute Miles) | ||||
|---|---|---|---|---|---|---|
| °C | °F | Heavy | Moderate | Light | Very Light | |
| Darkness | -1 and above | 30 and above | ≤ 1 | > 1 to 2 1/2 | > 2 1/2 to 4 | > 4 |
| Below -1 | Below 30 | ≤ 3/4 | > 3/4 to 1 1/2 | > 1 1/2 to 3 | > 3 | |
| Daylight | -1 and above | 30 and above | ≤ 1/2 | > 1/2 to 1 1/2 | > 1 1/2 to 3 | > 3 |
| Below -1 | Below 30 | ≤ 3/8 | > 3/8 to 7/8 | > 7/8 to 2 | > 2 | |